Updates LRO/LCROSS News and Updates

NASA TV Video: LRO Spacecraft Exposes Moon's Turbulent Past.​
 
Spaceflight Now: NASA moon orbiter begins two-year science mission:
As NASA shifts its focus away from moon as the next destination for human space travelers, the agency's lunar orbiter has completed a long-planned transition from an exploration to a scientific mission.

Command of the Lunar Reconnaissance Orbiter was handed over Thursday from NASA's exploration division to the science directorate, completing a yearlong mission devoted to scouting potential landing sites for future manned and robotic visits.
...
 
Moon's craters give new clues to early solar system bombardment.

A first-ever uniform, comprehensive catalog of large craters on the Moon is providing new clues to the bombardment history that characterized the chaotic early days of the inner solar system. In a paper that appears on the cover of Science, a research team led by Brown University identified and mapped more than 5,000 large craters, established the oldest regions on the Moon, and confirmed a theory about past solar system bombardment.

The Moon looks like a pockmarked golf ball. The dimples and divots on its surface are testament that our satellite has withstood a barrage of impacts from comets, asteroids and other space matter throughout much of its history. Because the geological record of that pummeling remains largely intact, scientists have leaned on the Moon to reconstruct the chaotic early days of the inner solar system.

Now a team led by Brown University planetary geologists has produced the first uniform, comprehensive catalog of large craters on the Moon that could shed light on the full-scale, planetary bombardment that characterized the inner solar system more than 4 billion years ago. In a paper appearing on the cover of Science, the team used data from the Lunar Orbiter Laser Altimeter, one of a suite of instruments aboard NASA’s Lunar Reconnaissance Orbiter, to identify and map 5,185 craters that are 20 kilometers in diameter or larger.

From the crater count and analysis, the team, which includes scientists from the Massachusetts Institute of Technology and the NASA Goddard Space Flight Center, determined the Moon’s oldest regions are the southern near side and the north-central far side. The group also confirmed that the South Pole–Aitken Basin is the oldest basin, meaning that any samples from there could be invaluable to further understanding the Moon and other bodies of the inner solar system.

In all, the findings “are telling us something about the infancy of the solar system,” said James W. Head III, a planetary geologist at Brown and the paper’s lead author. “It is clear we can find out and learn so much more from future missions, robotic or otherwise. There is so much to do.”

A major finding deals with the stream of projectiles pinballing throughout the inner solar system in its earliest days. For years, the prevailing wisdom was that the Moon was buffeted by a volley of space matter that held a steady ratio between larger and smaller objects, which planetary scientists refer to as “size-frequency distribution.”

The bombardment activity has never been questioned. But in 2005, the size-frequency distribution was challenged. In a paper in Science, a group led by University of Arizona geologist Robert Strom hypothesized that the ratio of larger and smaller objects striking the Moon had differed during its first billion years of existence. The Brown-led team’s crater analysis lends added credence to that hypothesis. The researchers studied impact craters formed early in the Moon’s history (when major basins were created by large projectiles striking the surface) and compared them with those they knew were formed later (when objects struck lava flows that had covered these basins). They found that the oldest surfaces (located in the lunar highlands) bore crater markings indicating a greater ratio of larger projectiles. The group looked in particular at Orientale Basin, formed by a massive impactor about 3.8 billion years ago, and determined that this is approximately when the era of larger projectiles versus smaller projectiles ended.

The finding opens a set of intriguing questions for what was going on in the inner solar system leading up to roughly the time that Orientale Basin was formed, said Caleb Fassett, a postdoctoral researcher at Brown and a contributing author on the paper.

“We know the asteroid belt has been spinning off projectiles at a relatively constant rate for three and a half billion years,” he said. “But now we go back earlier in the solar system’s history, and suddenly things are completely different. That implies there’s a different forcing to the asteroid belt. What has caused that different forcing is still not known.”

The scientists think the change may have been caused by the gravitational pull on the asteroid belt exerted by larger planets such as Jupiter and Saturn as they settled into their orbits, a temporary abundance of comets, an unexplained change in the size of matter emanating from the asteroid belt, or something else.

The Lunar Orbiter Laser Altimeter — LOLA — measures the Moon’s surface topography at a vertical precision of 10 centimeters using laser pulses bounced off the lunar surface just 25 meters apart.

“The topography of the Moon has been measured before, but this takes it to another level with the accuracy of data points and spatial resolution,” said Maria Zuber, a planetary geologist at MIT who earned her doctorate at Brown in 1986 and is a contributing author to the paper.

Seth Kadish, a graduate student at Brown, contributed to the study by analyzing the craters and assessing the results. Other authors are Erwan Mazarico and David Smith from MIT and Gregory Neumann from NASA Goddard. Head, Neumann, Smith, and Zuber are members of the NASA LOLA team.

NASA funded the research.

-----

Aviation Week: "Science Program Takes Charge Of LRO".
 
Researchers Discover New Types of Lunar Rock.

Silicic features are fundamentally different from the more typical basaltic mare and anorthositic highlands.

694.jpg

Diviner data superimposed on a Lunar Orbiter IV mosaic of Aristarchus crater. Red and orange colors indicate silicic compositions. Credit Stony Brook University Media Relations.

Two new studies of the minerals present in lunar soil and rocks have also been made using the LRO. One study was led by Benjamin Greenhagen of NASA’s Jet Propulsion Laboratory and analysed data from the LRO’s Diviner Lunar Radiometer Experiment (DLRE), which detects infrared radiation. As such, it is able to distinguish between different rock types and was used by Greenhagen and colleagues to identify regions of the lunar surface rich in silicics – igneous rock that forms from magma.

The other study was led by Timothy Glotch of Stony Brook University and focused on four silicic-rich areas. They found that the mid-infrared spectra from these regions can be best explained by the presence of certain compounds – specifically quartz, silicon-rich glass and alkali feldspar. The wide variety of landforms with these silic-rich regions suggests that magma once flowed both above and below the lunar crust. According to the researchers, this is a much greater level of igneous and geological activity than had been previously thought.

Dr. Timothy Glotch, assistant professor in the Department of Geosciences at Stony Brook and lead author of one of two papers on the research in a recent issue of Science, said scientists knew for decades that the moon’s crustal highlands were different from other regions, but couldn’t determine why. Now, he said, they have the evidence, which will lead to refined ideas about the moon’s formation.

“In layman’s terms, we have discovered a new and fundamentally different type of rock on the moon,” Glotch said.

The Diviner provides scientists with high-resolution infrared maps of the moon, which have enabled scientists to explore in more depth the composition of the moon’s crust.

Previous characterizations of lunar geology deemed it primitive, with two basic categories: the moon’s anorthositic highlands, which are rich in calcium and aluminum, and the moon’s basaltic maria, which are rich in iron and magnesium. The new findings indicate that other, more complex geologic occurrences, such as magmatic processing, may have led to the formation of the moon’s landscape.

“The silicic features we’ve found on the moon are fundamentally different from the more typical basaltic mare and anorthositic highlands,” Glotch said. “The fact that we see this composition in multiple geologic settings suggests that there may have been multiple processes producing these rocks.”

Read more at Physicsworld.com and ThreeVillage.Patch.com.
 
Laser Ranging of LRO:
http://lpod.wikispaces.com/September+23,+2010
LPOD-sept23-10.jpg

No, this is not deep sky observers answer to Moonlit nights! The picture above is not an attempt at blowing our Moon to smithereens to give month long darks skies, it is NASA Goddard pinging the LRO spacecraft with laser pulses on International Observe the Moon Night (InOMN). In this particular experiment above the LRO-Laser Ranging experment, the LRO spacecraft LOLA instrument has a receiver pointed at Earth that detects the laser pulses and then feeds the data back to the ground along with the usual surface LOLA ping data. The purpose is to give an accurate position of the spacecraft in order to make a better map of the Moon from the LOLA surface pings. The laser pulses are sent up to LRO at 28 pulses per second, out of phase to the surface pings, using a less powerful laser than that needed for the surface retroreflectors so it can be conducted with smaller telescopes and more often, in some cases around the clock, whenever the Moon is visible. The laser beams are made visible by moisture in the atmosphere on humid nights.
lrolr_concept1.jpg

Background on LRO Laser Ranging
 
New LROC Image: "Rainbows on the Moon".

M109168446CE.rainbow.crop.serendipityThumb.png

With the Sun exactly overhead, the illumination conditions and viewing angles of the LROC WAC create a rainbow effect in this image. 689 nm filter in red, 643 nm filter in green, and 604 nm filter in blue, from image M109168446C. Scene from north to south covers ~120 km [NASA/GSFC/Arizona State University].

In past featured images, we've seen great examples of the huge effect lighting can have on how the lunar surface looks in NAC images. With the color images from LROC's Wide Angle Camera (WAC), the effects can be just as extreme, and the design of the camera can lead to some unusual and scientifically rich observations. This is the case in the image above, where the 689 nm, 643 nm, and 604 nm filters are displayed in red, green, and blue, respectively. This image was acquired as the Sun was exactly overhead, allowing us to observe the "opposition surge". This is a surge in brightness that occurs when the Sun is directly behind the observer because of two effects. First, there are no shadows seen on the surface, because each boulder and grain of soil's shadow is hidden directly beneath it. Second, as the light reflects back to the observer it constructively interferes with itself.

M129221342CE.vis345.pho.serendipityThumb.png

The same scene, under more typical illumination conditions (Sun is 54° from the vertical). 689 nm filter in red, 643 nm filter in green, and 604 nm filter in blue from image M129221342C [NASA/GSFC/Arizona State University].

But why does the image above have a rainbow? Because each filter observes different pieces of the ground at different times, it observes the opposition surge at a slightly different time. When the observations from separate filters are combined to a single color image, this shifting bright spot is seen as a rainbow. When we make mosaics to look at color variations on the lunar surface, we use images where the Sun is a bit lower in the sky (around 30° from the vertical) where this extreme effect is no longer seen. But that doesn't mean these images aren't useful - they provide a huge new dataset for studying how light interacts with a particulate surface at different wavelengths. Perhaps an esoteric-sounding field of study, but this data can help us understand the reflectance images and spectra we have of the Moon and other bodies throughout the Solar System.

---------- Post added 5th Oct 2010 at 08:40 PM ---------- Previous post was 4th Oct 2010 at 08:55 PM ----------

NASA's LCROSS Wins 2010 Popular Mechanics Breakthrough Award.

NASA's Lunar CRater Observation and Sensing Satellite, or LCROSS, mission has won Popular Mechanics magazine's 2010 Breakthrough Award for innovation in science and technology.

The sixth annual Breakthrough Awards recognize innovators and products poised to change the world in fields such as technology, medicine, aviation and environmental engineering. Honorees will be celebrated during a ceremony tonight at Hearst Tower in New York City.

"The LCROSS mission truly was a technological achievement and made some game-changing discoveries in innovative ways," said S. Pete Worden, director of NASA's Ames Research Center in Moffett Field, Calif., which developed and managed science operations for the LCROSS mission. "We are honored by this recognition of the Ames and Northrop Grumman team that made this mission possible."

LCROSS was launched with the Lunar Reconnaissance Orbiter (LRO) on June 18, 2009. A team at Northrop Grumman built the LCROSS spacecraft, which was outfitted with commercial off-the-shelf instruments and ruggedized for spaceflight at Ames, saving the team time and the costly development of custom instruments.

NASA used the upper stage of the rocket that lofted LCROSS and LRO into lunar orbit, which would otherwise have become space debris, to impact a permanently shadowed crater near the south pole of the moon. LCROSS then flew through the dust kicked up by the impact and gathered data about what it contained. Soon after, in November 2009, the science team announced LCROSS had detected water in the dust plume in concentrations comparable to those of the Sahara Desert. The LCROSS team successfully completed the mission on time and under its $79 million budget.

"We chose the LCROSS mission for a Breakthrough Award because it set a new standard for low-cost, high-impact NASA programs," said James B. Meigs, editor-in-chief of Popular Mechanics. "Space exploration missions are rarely cheap, but a team from Ames and Northrop Grumman proposed a scrappy way to accomplish a monumental goal -- confirming the presence of water ice on the moon. We're thrilled to recognize the LCROSS team and all of this year's honorees, who are making the seemingly impossible a reality."

The individual LCROSS 2010 Breakthrough Award recipients are:
- Daniel Andrews, LCROSS project manager at Ames.
- Anthony Colaprete, LCROSS project scientist and principal investigator at Ames.
- Stephen Carman, LCROSS spacecraft project manager at Northrop Grumman.
- Craig Elder, LCROSS spacecraft manager at Northrop Grumman.

"We are honored to win this award," said Steve Hixson, vice president of Advanced Concepts - Space and Directed Energy Systems for Northrop Grumman Aerospace Systems in Redondo Beach, Calif. "It is a significant acknowledgement of the high caliber of our engineering skills and our close partnership with Ames, which developed the LCROSS payload and conducted mission operations. It also validates our ability to build small, inexpensive spacecraft with high science value very quickly, awakening the industry and the nation to the viability of this mission class."

For more information about the Breakthrough Awards, contact Hannah Plotkin at 646-695-7051. For more information on Northrop Grumman, contact Larry Whitley at 310-813-4897.

For more information about the LCROSS mission, visit:
www.nasa.gov/lcross
 
For those of you with 3D goggles! :thumbup:

----------

Slipher Crater: Fractured Moon in 3-D


Over time, the surface of the Moon fractures and buckles as it cools and shrinks, resulting in spectacular landforms. Stereo images provided by the LROC NAC allow a detailed look at these amazing features; view is to the east, foreground to background distance is ~3 km [NASA/GSFC/Arizona State University].

The wall of Slipher crater is deformed by one of many scarps found in the lunar highlands, which are thought to form as the Moon shrinks due to magma deep inside the Moon cooling and “freezing” to solid rock. Unlike water-ice (ice floats), most rocks are denser than their magma (you can think of water as magma and ice as rock), meaning rocks occupy less volume than their parent melt. As the interior of the Moon shrinks due to this volume change, the outer crust of the Moon wrinkles and folds, and the linear, rounded shape of the lobate scarp occurs as the crust breaks and one segment is thrust on top of another.


A broader view of the Slipher lobate scarp created by rotating the stereo-based topography with the image draped on top. The scarp is about 20 meters high, foreground to background distance is ~3.5km. View towards the east [NASA/GSFC/Arizona State University].

LROC NAC stereo observations allow scientists to create high resolution topographic maps, sometimes known as Digital Elevation Models (DEMs). A DEM is a simple raster (two dimensional array) file where each pixel represents the local elevation relative to a reference point. For these lunar data the reference is a sphere with a diameter of 1737.4 km – the average radius of the Moon. To visualize the DEM, software can be used to create views from any perspective, as in the images above where you appear to be hovering above the surface, looking at the terrain from the side.


For a 3-D effect, put on your anaglyph glasses (red on the left)! In this view, south is to the top of the image, width is 1.7 km [NASA/GSFC/Arizona State University].

Color shaded relief is another common product used to convey topography from a DEM. In the image below, a shaded relief map was generated from the DEM and then a color overlay was added that depicts the elevation. In this small area green values are the lowest and red areas the highest. DEMs are one of the most important datasets scientists use to analyze terrain and obtain quantitative measurements of height and slope.


Shaded relief map of a small portion of Slipher crater, image width is 2.0 km. North is up. [NASA/GSFC/Arizona State University].

Additionally, high-resolution topography gives engineers the means to decide the safest place to land a spacecraft, robotic or piloted. The new LROC topographic maps will enable future mission planners to select safe and feasible routes for rovers and explorers. What questions are left regarding these fascinating scarps? How would astronauts investigate their origin? Right now LROC is collecting high resolution images from all over the Moon. As the data accumulates, scientists can explore spatial relations between the scarps themselves and the their surroundings. For example, you can see Slipher crater has a somewhat square form (similar to Meteor Crater, AZ) indicating pre-existing fractures in the crust. We do know that the Slipher scarp formed as the crust was compressed – what role did the older fractures have in the location and size of the scarp? What triggered the compression event? Did the scarp form in one instant or over a series of events? Detailed examination of the fault surfaces, combined with a long term seismic characterization, would reveal the complex history of the Slipher scarp and the highland scarps in general. So there is much to do in terms of unraveling the thermal and seismic history of the Moon!

What a fantastic destination for explorers – imagine seeing the Slipher scarp appear while descending to the Moon’s surface! In the meantime, 3-D anaglyphs help you see the landscape as it would appear as your spacecraft comes close to the surface.

For more information about the use of LROC NAC images in DEM generation and topography studies, be sure to check out the featured images.
 
Sinus Iridum - Next Destination?


LROC WAC topography of Sinus Iridum, blue shows the lowest areas and red the highest. From promontory to promontory Sinus Iridum is 235 km across [NASA/GSFC/Arizona State University].

Wow - five spacecraft launched to the Moon in three years! The latest is China's second lunar orbiter, Chang'e 2, which was launched 1 October 2010 and arrived at the Moon on 6 October. Chang'e 2 carries a higher resolution camera than Chang'e 1 that may help Chinese scientists scout out the proposed landing site for their upcoming lander/rover, Chang'e 3. Currently the Chinese lander is slated to land in Sinus Iridum (Bay of Rainbows) sometime before 2013. Why Sinus Iridum? The WAC topographic map shows the area to be very flat and nearly featureless. However as the LROC Narrow Angle Camera (NAC) keeps showing us, there are no featureless spots on the Moon - everywhere on the Moon is fascinating!


Boulders resting on the top of a wrinkle ridge in the middle of Sinus Iridum. Where did they come from? LROC NAC M124749832R [NASA/GSFC/Arizona State University].

Sinus Iridum is a mare-filled impact crater that superposes the Imbrium basin. It is far from any Apollo landing sites, with the closest (Apollo 15) being more than 1000 km distant. Scientists would love to have a look at the chemistry of these basalts - how much do they differ from the Apollo 15 basalts which are from the other side of Imbrium? Wrinkle ridges cross the mare, and in places families of boulders are perched on the ridges. Are the boulders weathering out of the ridge? Many small irregular shaped craters dots Sinus Iridum, how were they formed? The LROC team will post selected NACs over the coming weeks, you can join the effort to explore this future landing site now!

Explore the whole of Sinus Iridum with a WAC BW mosaic!

The topographic color was produced as a by-product of stereo analysis of the WAC global dataset. Producing the global Digital Elevation Model (DEM) is a big job being led by LROC team members at the German Aerospace Center (DLR) in Berlin. This winter a global 100 meter DEM will be released.

---------- Post added at 10:31 PM ---------- Previous post was at 06:11 PM ----------

NASA Hosts Media Telecon Featuring Results of Moon Mission Impact.

The Science journal has embargoed information until 2 p.m. EDT on Oct. 21.

NASA will host a media teleconference at 2 p.m. EDT on Thursday, Oct. 21, to discuss additional findings from NASA's Lunar CRater Observation and Sensing Satellite, or LCROSS, and NASA's Lunar Reconnaissance Orbiter, or LRO, missions.

The results will be featured in six papers published in the Oct. 22 issue of the journal Science. The journal's embargo on these results will be lifted at the start of the telecon. The briefing will focus on the data from:
-- The Diviner Lunar Radiometer Experiment which measures surface and subsurface temperatures from orbit.
-- The Lyman Alpha Mapping Project which is mapping the entire lunar surface in the far ultraviolet spectrum.
-- The Lunar Exploration Neutron Detector which creates high-resolution maps of hydrogen distribution and gathers information about the neutron component of the lunar radiation environment.

The panelists are:
-- Michael Wargo, chief lunar scientist, Exploration Systems Mission Directorate, NASA Headquarters, Washington.
-- Anthony Colaprete, LCROSS project scientist and principal investigator, NASA's Ames Research Center, Moffett Field, Calif.
-- David Paige, Diviner instrument principal investigator, University of California, Los Angeles (UCLA).
-- Igor Mitrofanov, Lunar Exploration Neutron Detector principal investigator, Institute for Space Research, Moscow.
-- Peter Schultz, professor of geological sciences, Brown University, Providence, R.I. and LCROSS science team member.
-- Paul Hayne, graduate student at UCLA and Diviner team member.
-- Randy Gladstone, Lyman--Alpha Mapping Project deputy principal investigator, Southwest Research Institute, San Antonio.
-- Richard Vondrak, LRO project scientist, NASA's Goddard Space Flight Center, Greenbelt, Md.

To participate in the teleconference, reporters should contact Michael Braukus at [email protected] or at 202-358-1979. Requests must include media affiliation and telephone number.

To view supporting information available at the start of the teleconference, visit:
www.nasa.gov/lcross

Audio of the teleconference will be streamed live at:
www.nasa.gov/newsaudio
 
Nice post!

You know you're addicted to Orbiter when...

You look for evidence of Brighton Beach in the last post's photos.
 
NASA will host a media teleconference at 2 p.m. EDT on Thursday, Oct. 21, to discuss additional findings from NASA's Lunar CRater Observation and Sensing Satellite, or LCROSS, and NASA's Lunar Reconnaissance Orbiter, or LRO, missions.

Audio of the teleconference will be streamed live at:
www.nasa.gov/newsaudio

Direct links to audio streams for the teleconference:

---------- Post added 22nd Oct 2010 at 01:18 ---------- Previous post was 21st Oct 2010 at 19:41 ----------

NASA:
LRO Supports Historic Lunar Impact Mission


The lunar rocks brought back to the Earth by the Apollo astronauts were found to have very little water, and to be much drier than rocks on Earth. An explanation for this was that the Moon formed billions of years ago in the solar system's turbulent youth, when a Mars-sized planet crashed into Earth. The impact stripped away our planet's outer layer, sending it into orbit. The pieces later coalesced under their own gravity to form our Moon. Heat from all this mayhem vaporized most of the water in the lunar material, so the water was lost to space.

However, there was still a chance that water might be found in special places on the Moon. Due to the Moon's orientation to the Sun, scientists theorized that deep craters at the lunar poles would be in permanent shadow and thus extremely cold and able to trap volatile material like water as ice perhaps delivered there by comet impacts or chemical reactions with hydrogen carried by the solar wind.

NASA scientists have revealed the lunar soil inside shadowy craters is rich in useful materials, that the moon is chemically active, and that it also has a water cycle. The Lunar Reconnaissance Orbiter, by observing the impact of the LCROSS spacecraft, helped contribute to these new findings.

Last year on October 9, NASA's LCROSS (Lunar Crater Remote Observation and Sensing Satellite) intentionally crashed its companion Centaur upper stage into the Cabeus crater near the lunar south pole. The idea was to kick up debris from the bottom of the crater so its composition could be analyzed. The Centaur hit at over 5,600 miles per hour, sending up a plume of material over 12 miles high.

"Seeing mostly pure water ice grains in the plume means water ice was somehow delivered or chemical processes are causing ice to accumulate in large quantities," said Anthony Colaprete, LCROSS project scientist and principal investigator at NASA's Ames Research Center, Moffett Field, Calif. "Furthermore, the diversity and abundance of certain materials called volatiles in the plume, suggest a variety of sources, like comets and asteroids, and an active water cycle within the lunar shadows."

[table="head;width=400"]{colsp=2}Click on images to view larger versions

|

This is an artist's rendering of the LCROSS spacecraft (foreground) and Centaur separation. Credit: NASA|This is an artist's rendering of the Lunar Reconnaissance Orbiter spacecraft. Credit: NASA[/table]​

LCROSS was a companion mission to NASA's Lunar Reconnaissance Orbiter (LRO) mission.

The two missions were designed to work together, and support from LRO was critical to the success of LCROSS. During impact, LRO, which is normally looking at the lunar surface, was tilted toward the horizon so it could observe the plume. Shortly after the Centaur hit the Moon, LRO flew past debris and gas from the impact while its instruments collected data.

"LRO assisted LCROSS in two primary ways -- selecting the impact site and confirming the LCROSS observations," said Gordon Chin of NASA's Goddard Space Flight Center, Greenbelt, Md., LRO associate project scientist.

"Since observatories on Earth were also planning to view the impact, there were a lot of constraints on the location -- the impact plume had to rise out of the crater and into sunlight, and it had to be visible from Earth," said Chin.

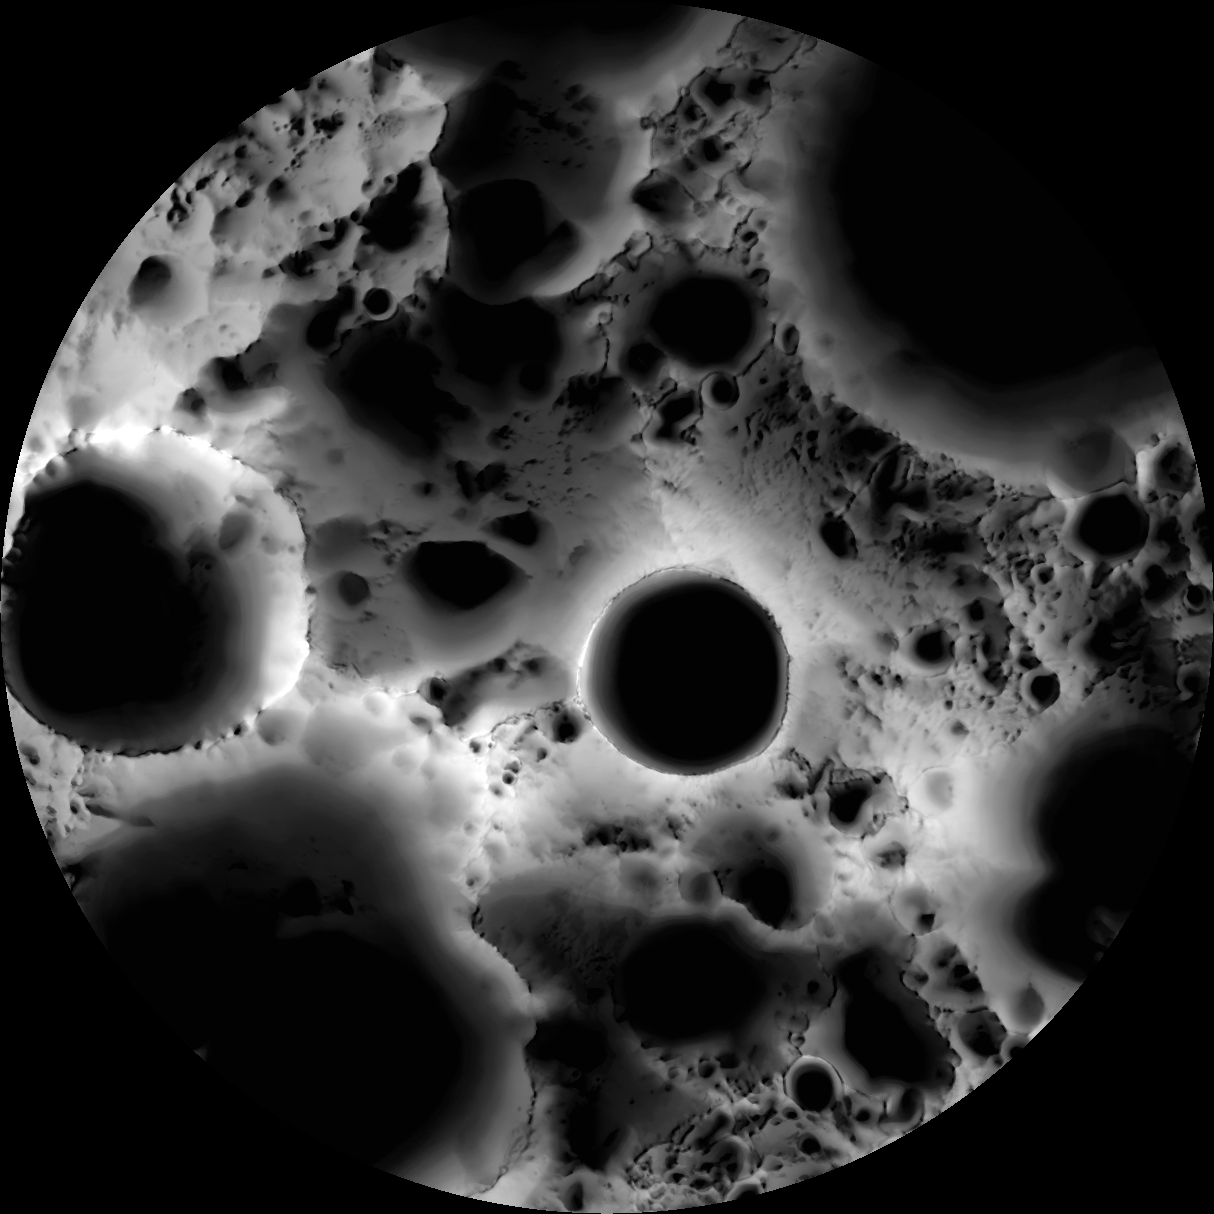
Prior to the impact, LRO's instruments worked together to map and provide details on the polar regions, according to Chin. For example, LRO's Lunar Orbiter Laser Altimeter (LOLA) instrument built up three-dimensional (topographic) maps of the surface. This data was plugged into computer simulations to see how shadows change as the Moon moves in its orbit, so that regions in permanent shadow could be identified. The Lunar Reconnaissance Orbiter Camera (LROC) helped by making images of the actual regions of light and shade, which were used to verify the simulation's accuracy. Finally, LOLA measured the depths of polar craters to find areas where the impact could still be seen from Earth.

Since hydrogen is a component of water, maps of lunar hydrogen deposits are useful for finding areas that might hold water. Preliminary hydrogen maps were provided by the spacecraft's Lunar Exploration Neutron Detector (LEND) instrument. Regions that had relatively high amounts of hydrogen were identified as the most promising for the impact.

"Over a year ago, we formally suggested Cabeus to the LCROSS principal investigator," said LEND principal investigator, Igor Mitrofanov of the Institute for Space Research, Moscow. "According to our current data, the regolith within the Cabeus impact crater may have the highest content of water anywhere on the Moon, perhaps up 4.0 percent weight."

"Originally, the LCROSS team was going with a site further north than the Cabeus crater, because it was better for Earth visibility," said Chin. "However, LEND revealed that the area did not have a high hydrogen concentration, but Cabeus did. Also, Diviner showed that Cabeus was one of the coldest sites, and LOLA indicated it was in permanent shadow. So, we were able to inform the decision to aim for Cabeus further south -- while it was a little less visible from Earth, Cabeus was ultimately better for what we were trying to find."

Temperature maps from LRO's Diviner instrument were also crucial to identify where the coldest places were.

David Paige, principal Investigator of the Diviner instrument from the University of California, Los Angeles, used temperature measurements of the lunar south pole obtained by Diviner to model the stability of water ice both at and near the surface.

"The temperatures inside these permanently shadowed craters are even colder than we had expected. Our model results indicate that in these extreme cold conditions, surface deposits of water ice would almost certainly be stable," said Paige, "but perhaps more significantly, these areas are surrounded by much larger permafrost regions where ice could be stable just beneath the surface."

"We conclude that large areas of the lunar south pole are cold enough to trap not only water ice, but other volatile compounds (substances with low boiling points) such as sulfur dioxide, carbon dioxide, formaldehyde, ammonia, methanol, mercury and sodium," Paige added.

[table="head;width=400"]{colsp=2}Click on images to view larger versions

|

LCROSS LRO Diviner Lunar Radiometer Experiment surface temperature map of the south polar region of the moon. The map shows the locations of several intensely cold impact craters that are potential cold traps for water ice as well as a range of other icy compounds commonly observed in comets. The LCROSS spacecraft was targeted to impact one of the coldest of these craters, and many of these compounds were observed in the ejecta plume. Credit: UCLA/NASA/Jet Propulsion Laboratory, Pasadena, Calif./Goddard|LCROSS Diviner brightness temperature swath acquired about 90 seconds after the LCROSS impact, the location of which is indicated by the white arrow. Based on the Diviner measurements, the impact site was heated to more than 380°C (1,300°F). Credit: UCLA/NASA/JPL/Goddard[/table]​


UCLA graduate student and Diviner team member, Paul Hayne, was monitoring the data in real-time as it was sent back from Diviner.

"During the fly-by 90 seconds after impact, all seven of Diviner's infrared channels measured an enhanced thermal signal from the crater. The more sensitive of its two solar channels also measured the thermal signal, along with reflected sunlight from the impact plume. Two hours later, the three longest wavelength channels picked up the signal, and after four hours only one channel detected anything above the background temperature."

Scientists were able to learn two things from these measurements: first, they were able to constrain the mass of material that was ejected outwards into space from the impact crater; second, they were able to infer the initial temperature and make estimates about the effects of ice in the soil on the observed cooling behavior.

Another LRO instrument, the Lyman-Alpha Mapping Project (LAMP), used data on the gas cloud to confirm the presence of the molecular hydrogen, carbon monoxide and atomic mercury, along with smaller amounts of calcium and magnesium, all in gaseous form.

"We had hints from Apollo soils and models that the volatiles we see in the impact plume have been long collecting near the Moon’s polar regions," said Randy Gladstone, LAMP acting principal investigator, of Southwest Research Institute (SwRI) in San Antonio, Texas. "Now we have confirmation."

"The detection of mercury in the soil was the biggest surprise, especially that it’s in about the same abundance as the water detected by LCROSS," said Kurt Retherford, LAMP team member, also of SwRI.

"The observations by the suite of LRO and LCROSS instruments demonstrate the moon has a complex environment that experiences intriguing chemical processes," said Richard Vondrak, LRO project scientist at NASA Goddard. "This knowledge can open doors to new areas of research and exploration."

LCROSS launched with LRO aboard an Atlas V rocket from Cape Canaveral, Fla., on June 18, 2009.

The research was funded by NASA's Exploration Systems Missions Directorate at NASA Headquarters in Washington. LRO was built and is managed by NASA's Goddard Space Flight Center in Greenbelt, Md. LCROSS is managed by NASA's Ames Research Center, Moffett Field, Calif. LAMP was developed by the Southwest Research Institute in San Antonio, Texas; LOLA was built by NASA Goddard; LROC was provided by Arizona State University, Tempe; LEND was provided by Institute for Space Research, Moscow; The Diviner instrument was built and is managed by NASA’s Jet Propulsion Laboratory in Pasadena, Calif. UCLA is the home institution of Diviner’s principal investigator.

Bill Steigerwald
NASA's Goddard Space Flight Center, Greenbelt, Md.


----------------------------------------

NASA:
Media briefing materials
Media Telecon: LCROSS and LRO Science Science Results of Lunar Impact


A replay of the teleconference will be available until Nov. 4, 2010 by dialing 888-566-0674 from within the United States, or 203-369-3084 internationally. Passcode is 6267.

...

----------------------------------------

Spaceflight Now: Lunar impact mission scooped up more than water.

---------- Post added at 03:53 ---------- Previous post was at 01:18 ----------

A small list of (mostly redundant) articles related to additional findings from impact of LCROSS:
 
NASA:
NASA's LRO Creating Unprecedented Topographic Map of Moon


NASA's Lunar Reconnaissance Orbiter is allowing researchers to create the most precise and complete map to date of the moon's complex, heavily cratered landscape.

"This dataset is being used to make digital elevation and terrain maps that will be a fundamental reference for future scientific and human exploration missions to the moon," said Dr. Gregory Neumann of NASA's Goddard Space Flight Center in Greenbelt, Md. "After about one year taking data, we already have nearly 3 billion data points from the Lunar Orbiter Laser Altimeter on board the LRO spacecraft, with near-uniform longitudinal coverage. We expect to continue to make measurements at this rate through the next two years of the science phase of the mission and beyond. Near the poles, we expect to provide near-GPS-like navigational capability as coverage is denser due to the spacecraft's polar orbit." Neumann will present the map at the American Geophysical Union meeting in San Francisco December 17.

[table="head;width=675"]{colsp=3}
Click on images to view medium resolution versions / Click on "Full-resolution copy" for full resolution TIFF versions​

||

||
LOLA topographic map of moon's southern hemisphere LOLA topographic map of the moon's southern hemisphere. The false colors indicate elevation: red areas are highest and blue lowest. Credit: NASA/GSFC/MIT/SVS|LOLA topographic map of moon's northern hemisphere LOLA topographic map of the moon's northern hemisphere. The false colors indicate elevation: red areas are highest and blue lowest. Credit: NASA/GSFC/MIT/SVS|LOLA topographic map centered on Apollo 15 landing site LOLA topographic map centered on the Apollo 15 landing site, highlighting the Apennine and Caucasus ranges and the fairly subtle wrinkling in Serenitatis. The false colors indicate elevation: red areas are highest and blue lowest. Credit: NASA/GSFC/MIT/SVS[/table]​


The Lunar Orbiter Laser Altimeter (LOLA) works by propagating a single laser pulse through a Diffractive Optical Element that splits it into five beams. These beams then strike and are backscattered from the lunar surface. From the return pulse, the LOLA electronics determines the time of flight which, accounting for the speed of light, provides a precise measurement of the range from the spacecraft to the lunar surface. Range measurements, combined with accurate tracking of the spacecraft's location, are used to build a map revealing the contours of the lunar landscape. The five beams create a two-dimensional spot pattern that unambiguously reveals slopes. LOLA will also measure the spreading of the return pulse to get the surface roughness and the change in the transmitted compared to the return energy of the pulse to determine surface reflectance.

The new LOLA maps are more accurate and sample more places on the lunar surface than any available before. "The positional errors of image mosaics of the lunar far side, where direct spacecraft tracking – the most accurate -- is unavailable, have been one to ten kilometers (about 0.62 to 6.2 miles)," said Neumann. "We're beating these down to the level of 30 meters (almost 100 feet) or less spatially and one meter (almost 3.3 feet) vertically. At the poles, where illumination rarely provides more than a glimpse of the topography below the crater peaks, we found systematic horizontal errors of hundreds of meters (hundreds of yards) as well." In terms of coverage, the nearly three billion range measurements so far by LRO compare to about eight million to nine million each from three recent international lunar missions, according to Neumann. "They were limited to a mile or so between individual data points, whereas our measurements are spaced about 57 meters (about 187 feet) apart in five adjacent tracks separated by about 15 meters (almost 50 feet)."

"Recent papers have clarified some aspects of lunar processes based solely on the more precise topography provided by the new LOLA maps," adds Neumann, "such as lunar crater density and resurfacing by impacts, or the formation of multi-ring basins."

"The LOLA data also allow us to define the current and historical illumination environment on the moon," said Neumann. Lunar illumination history is important for discovering areas that have been shaded for long periods. Such places, typically in deep craters near the lunar poles, act like cold storage, and are capable of accumulating and preserving volatile material like water ice.

The landscape in polar craters is mysterious because their depths are often in shadow. The new LOLA dataset is illuminating details of their topography for the first time. "Until LRO and the recent Japanese Kaguya mission, we had no idea of what the extremes of polar crater slopes were," said Neumann. "Now, we find slopes of 36 degrees over several kilometers (several thousands of yards) in Shackleton crater, for example, which would make traverses quite difficult and apparently causes landslides. The LOLA measurements of shadowed polar crater slopes and their surface roughness take place at scales from lander size to kilometers. These measurements are helping the LRO science team model the thermal environment of these craters, and team members are developing temperature maps of them."

{...}
 
Aviation Week: High-Res Lunar Maps Ready For Explorers:
Future human explorers on the Moon can plan their routes in great detail, now that the final load of exploration data from NASA’s Lunar Reconnaissance Orbiter (LRO) has been released.

{...}

LRO spent a year — September 2009-September 2010 — mapping the lunar surface in rich detail at a resolution of 100 meters per pixel. In addition, its suite of seven instruments collected information on everything from illumination to mineralogy.

Collected from polar orbit at an altitude of 50 km (33 mi.), the dataset totals 192 terabytes — the capacity of about 41,000 standard DVDs.

Early users are more likely to be planetary scientists than human-mission planners, since NASA has dropped its work on returning to the Moon along with the Constellation program. The lunar orbiter’s Diviner Lunar Radiometer Experiment, for example, has generated more than 1,700 digital maps of surface minerals, visual and infrared brightness, day and night temperatures, and rock abundance. Researchers can overlay those maps with others in the dataset.

“All these global maps and other data are available at a very high resolution,” says John Keller of NASA’s Goddard Space Flight Center, the LRO deputy project scientist. “With this valuable collection, researchers worldwide are getting the best view of the Moon they have ever had.”

At the completion of the mapping mission, control of the LRO passed from NASA’s Exploration Systems Mission Directorate — soon to be merged with the Space Operations directorate — to the Science Mission Directorate for a more focused research program. Like the rest of the planetary data NASA makes available, the LRO dataset is available at the online Planetary Data System at pds.nasa.gov.

Now, who wants to make level 14 global coverage textures of Moon for Orbiter? :P
 
Multi-temporal illumination map of the lunar south pole generated from LRO WAC images:
http://lroc.sese.asu.edu/news/index.php?/archives/321-South-Pole-Illumination-Map.html

In a six month (six lunar days) period, the LROC Wide Angle Camera (WAC) collected 1,700 images of the South Pole covering the same area. Each image was map projected and converted to a binary image (if the ground was illuminated that pixel was set to one, and if shadowed zero) to differentiate between sunlit and shadowed regions. All the binary images were then stacked, and then for each pixel it was determined what percentage of the time during six months that spot was illuminated. Presto - an illumination map!
 
NASA:
LRO Takes Extreme Close-up of Eclipse

June 13, 2011

Orbiting about 31 miles above the lunar surface, NASA's Lunar Reconnaissance Orbiter (LRO) spacecraft will get a "front-row seat" to the total lunar eclipse on June 15, says Noah Petro, Associate Project Scientist for LRO at NASA's Goddard Space Flight Center in Greenbelt, Md.


A lunar eclipse happens when the moon passes into Earth's shadow, and a total lunar eclipse occurs when Earth completely blocks the sun, causing the moon to darken and appear to change color. However, the moon doesn't go completely dark because Earth's atmosphere bends (refracts) indirect sunlight toward the moon, giving it dim illumination. Since indirect sunlight must travel through Earth's atmosphere before reaching the moon, any clouds or dust in the atmosphere will block certain colors in the sunlight, causing the moon to seem to change color, frequently turning it yellow, orange, or red. The exact color varies from eclipse to eclipse, depending on the weather at the time.

The June 15 lunar eclipse will be visible, at least in part, from around the world except North and Central America. "However, LRO will be observing, so eventually everyone will get to see a close-up of it," says Petro. The eclipse begins at about 17:24 Universal Time (UT), will be darkest from around 19:22 UT to 21:02 UT, and ends a bit after 23:00 UT. During this eclipse, the moon's orbital path will take it close to the center of the darkest part of Earth's shadow, called the umbra, so the deepest part of the eclipse will last a long time -- just over an hour and 40 minutes. Unlike a solar eclipse, a lunar eclipse is safe to view without special equipment.

LRO's Diviner Lunar Radiometer instrument will record how quickly different areas on the moon's day side cool off during the eclipse. Since large boulders cool more slowly than a fine-grained or dusty surface, Diviner will be able to see what areas are covered with boulders and what regions are blanketed by dust.


"This is an unprecedented opportunity to learn more about the uppermost few millimeters of the moon," says Diviner Principal Investigator David Paige of the University of California, Los Angeles. "Diviner plans to operate continuously during the entire eclipse period, targeting ten specific regions. The ten sites represent a diverse selection of lunar terrains. Some consist of fine dust, others are rocky, and there are a variety of compositions including dark, iron-rich lunar maria and light, iron-poor lunar highlands. Diviner will target these features before, during, and after the eclipse, which will allow us to observe how these different surfaces respond to the sudden drop in temperature."

"The moon turns slowly -- a complete day-night cycle lasts more than 29 Earth days," says Petro. "So lunar dusk and dawn last a long time, and normally the lunar surface cools down and heats up slowly. This eclipse is a special opportunity to see what happens if you 'switch off' the sun relatively quickly. It's like taking a pie out of the oven and throwing it into the freezer without letting it cool down first. We want to see how the moon's surface responds to this abrupt temperature change," said Petro.

The Diviner observations will complement surface roughness measurements from LRO's other instruments because Diviner can get hints at what lies just beneath the surface, according to Petro. "LRO's camera and laser altimeter might see a flat, dusty region, but if Diviner sees that it is cooling unusually slowly, that tells us large blocks of material are hidden beneath a thin layer of dust," said Petro.

The eclipse presents unusual conditions for LRO, according to Petro. LRO runs on solar energy, with battery back-up for power during its approximately hour-long journey over the moon's night side each orbit. LRO's other instruments will be turned off to conserve energy during the long night imposed by the eclipse, and the spacecraft will have to endure a longer period of deep cold.

"It will be like taking my car off-road. It's not really built for that, but it can handle limited excursions," said Petro. This will be the first time LRO operates an instrument during a total lunar eclipse, according to Petro, and it will be the longest eclipse during the mission's expected lifetime.

Paige and his Diviner team will lead the observations, with funding from NASA's Science Mission Directorate, NASA Headquarters, Washington. NASA Goddard assembled and manages LRO.

{...}
 
NASA:
June 17, 2011​
MEDIA ADVISORY : M11-124
NASA Schedules Telecon To Highlight Lunar Mission Results


WASHINGTON -- NASA will host a media teleconference at 2 p.m. EDT [18:00 UTC] on Tuesday, June 21, to highlight the results of the Lunar Reconnaissance Orbiter (LRO) mission. A panel will summarize the spacecraft's science findings and discuss the agency's plans for LRO's future.

Telecon panelists are:
  • Douglas Cooke, associate administrator, Exploration Systems Mission Directorate at NASA Headquarters in Washington
  • Michael Wargo, chief lunar scientist for exploration at NASA Headquarters
  • Richard Vondrak, LRO project scientist at NASA's Goddard Space Flight Center in Greenbelt, Md.
{...}

NASA will stream live audio of the teleconference at:


{...}
 
NASA:
LRO Showing Us the Moon as Never Before

June 21, 2011

NASA's Lunar Reconnaissance Orbiter (LRO) has forever changed our view of the moon, literally bringing it into sharper focus and showing us the whole globe in unprecedented detail.

This rich new portrait has been rendered by LRO's seven onboard instruments, which together have delivered more than 192 terabytes of data, images and maps -- the equivalent of nearly 41,000 typical DVDs. "This is a tremendous accomplishment," says Douglas Cooke, Associate Administrator of the Exploration Systems Mission Directorate at NASA Headquarters, Washington. "The exploration phase of the mission delivered a lot more than it originally promised, and that's been just the beginning for LRO."

The primary objective of the mission was to enable safe and effective exploration of the moon. "To do so, we needed to leverage the very best that the science community had to offer," says Michael Wargo, chief lunar scientist of the Exploration Systems Mission Directorate at NASA Headquarters, Washington. "And by doing that, we've fundamentally changed our scientific understanding of the moon."

[table="head;width=225"]
Click on image for details / video​


A LOLA digital elevation map compiled in late 2009 (right) is compared to the Unified Lunar Control Network (ULCN) 2005, a painstakingly constructed map based on the best available data at the time, compiled by the U.S. Geological Survey.
(Credit: NASA's Goddard Space Flight Center's Science Visualization Studio/Massachusetts Institute of Technology)​
[/table]​


The most precise and complete topographic maps to date of the moon's complex, heavily cratered landscape have been created from the more than 4 billion measurements -- and still counting -- taken by LRO's Lunar Orbiter Laser Altimeter (LOLA). These maps are more accurate and sample more places on the lunar surface than any available before. In fact, LOLA has taken more than 100 times more measurements than all previous lunar instruments of its kind combined, opening up a world of possibilities for future exploration and for science.

[table="head;width=225"]
Click on image for details​


LOLA data give us three complementary views of the near side of the moon: the contours of the landscape, or topography (left), along with new maps of the surface slope values (middle) and the roughness of the topography (right). All three views are centered on the relatively young impact crater Tycho, with the Orientale basin on the left side. The slope magnitude indicates the steepness of terrain, while roughness indicates the presence of large blocks, both of which are important for surface operations.
Credit: NASA/Goddard/Massachusetts Institute of Technology​
[/table]​

Already, researchers have used LOLA data to put together the first comprehensive set of maps of the roughness of the moon's surface. Like wrinkles on skin, the roughness of craters and other features on the moon's surface can reveal their age. By looking at where and how the roughness changes -- and by combining that information with contour maps that show where the high and low points are -- researchers can get important clues about the processes that shaped the moon.

"Before LRO, we actually knew the shape of Mars better than we knew the shape of the moon, our nearest neighbor," notes LRO's Deputy Project Scientist, John Keller of NASA's Goddard Space Flight Center in Greenbelt, Md. "But because of LRO and LOLA, we now have detailed maps of both the near side and far side of the moon."

Though less familiar than the instantly recognizable near side, the moon's far side is no less fascinating. The far side is rougher and houses more craters, including one of the biggest impact basins in the solar system, called South Pole-Aitken. This remnant of an ancient and immensely powerful impact left such a profound crater that 34 Empire State Buildings stacked on top of each other still would not reach from its depths to its rim.

"With the wealth of data from LRO freely available, everyone can get to know the far side of the moon just as well as the near side," says Wargo.

A World of Resources

LRO's search for resources has revealed that the moon is even more extreme than we thought.

In the polar regions, deep and long-shaded craters, such as Shackleton crater in the south, have been of special interest because they can act as cold storage, capable of accumulating and preserving volatile material like water ice. But it was while studying Hermite crater near the moon's north pole that the mission's Diviner Lunar Radiometer Experiment found the coldest spot in solar system, with a temperature of -415 degrees Fahrenheit (-248 degrees Celsius or 25 Kelvins).


To further explore these regions, LRO's Lyman Alpha Mapping Project (LAMP), which can "see" in the dark, is imaging the shaded areas. Already, LOLA's precise measurements have been used to map solar illumination; this work has provided new insight into the shadowed regions and also revealed areas that receive nearly continuous sun. Because sunlight itself is a resource on the moon, knowing that there are areas that get sun for approximately 243 days a year and never have a period of total darkness for more than 24 hours is extremely valuable.

Complementing those efforts are both the Lunar Exploration Neutron Detector (LEND) and the Miniature Radio Frequency (Mini-RF) advanced radar. They are searching for deposits of water ice. LEND also seeks hydrogen, a resource of interest because of its potential use as fuel. And at the same time, the Cosmic Ray Telescope for the Effects of Radiation (CRaTER) studies the lunar radiation environment, which is important for keeping our astronauts healthy and safe as they explore.


A Picnic on the Moon

Stunning details of the moon's surface have been revealed by the Lunar Reconnaissance Orbiter Camera (LROC), which imaged nearly 5.7 million square kilometers of the moon's surface during the exploration phase of the mission. That is roughly the same amount of land as all contiguous states west of the Mississippi River.

Though earlier missions also imaged the moon, what sets LROC apart is its ability to image with surface pixels that are only 1.5 feet in size, small enough to distinguish details never before possible.

"With this resolution, LRO could easily spot a picnic table on the moon," says LRO's Project Scientist, Richard Vondrak of NASA Goddard.

And thanks to some operational efficiencies, the dual Narrow Angle Cameras that are part of LROC have delivered 50 percent more images than initially expected.

LRO was charged with surveying specific sites but with the added goal of making measurements globally across the moon. "LRO is designed to look down all the time, and most of the instruments are collecting data all the time," Wargo explains. "This, along with LRO's performance and reliability, has given us a more comprehensive view of the moon than ever before."

And there's plenty more to come from LRO. "Not only did we accomplish all of this during the exploration phase of the mission," says Vondrak, "but two more years of wonderful science are already under way."

{...}


LRO Latest Results Briefing Materials


LRO a resounding success


The Lunar Reconnaissance Orbiter (LRO) has been declared a full mission success by NASA, delivering more than promised and forever changing our view of the Moon.

Launched on 18 June 2009, the $540 million spacecraft's primary objective was to create a comprehensive atlas of the Moon's features and resources necessary to design a future manned lunar outpost.

"LRO was originally conceived to deliver the kinds of information that we need to plan for safe and effective exploration of our Moon," says Michael Wargo, chief lunar scientist for exploration at NASA headquarters. "And that's exactly what we did, in spades. And by doing that, we've fundamentally changed our scientific understanding of the Moon."

Whole article
 
NASA:
June 30, 2011​
Sunrise View of Tycho Crater's Peak

On June 10, 2011, NASA's Lunar Reconnaissance Orbiter spacecraft angled its orbit 65° to the west, allowing the LRO Camera NACs to capture a dramatic sunrise view of Tycho crater.


[table="head;width=400"]
Click on image for details​


Tycho crater's central peak complex, shown here, is about 9.3 miles (15 km) wide, left to right (southeast to northwest in this view)
(Credit: NASA Goddard/Arizona State University)​
[/table]​


A very popular target with amateur astronomers, Tycho is located at 43.37°S, 348.68°E, and is about 51 miles (82 km) in diameter. The summit of the central peak is 1.24 miles (2 km) above the crater floor. The distance from Tycho's floor to its rim is about 2.92 miles (4.7 km).


[table="head;width=400"]
Click on image to enlarge​


This image shows an oblique (angled) view of the summit area of Tycho crater's central peak. The boulder in the background is nearly 400 feet (120 m) wide. The image itself is about 3/4ths of a mile wide.
(Credit: NASA Goddard/Arizona State University)​
[/table]

[table="head;width=225"]
Click on image to enlarge​


This LRO image mosaic shows Tycho crater under lighting conditions similar to those when the above "oblique" image was taken. North is up in this image, which is about 81 miles wide (130 km).
Credit: NASA Goddard/Arizona State University​

[/table]​


Many rock fragments ("clasts") ranging in size from some 33 feet (10 m) to hundreds of yards are exposed in the central peak slopes. Were these distinctive outcrops formed as a result of crushing and deformation of the target rock as the peak grew? Or do they represent preexisting rock layers that were brought intact to the surface?

Tycho's features are so steep and sharp because the crater is only about 110 million years old -- young by lunar standards. Over time micrometeorites and not-so-micro meteorites, will grind and erode these steep slopes into smooth mountains. For a preview of Tycho's central peak may appear like in a few billion years, look at Bhabha crater.

On May 27, 2010, LRO captured a top-down view of the summit (below), including the large boulder seen in the above image. Also note the fractured impact melt deposit that surrounds the boulder. And the smooth area on top of the boulder, is that also frozen impact melt? These images from the LRO Camera clearly show that the central peak formed very quickly: The peak was there when impact melt that was thrown straight up during the impact came back down, creating mountains almost instantaneously. Or did the melt get there by a different mechanism? The fractures probably formed over time as the steep walls of the central peak slowly eroded and slipped downhill. Eventually the peak will erode back, and this massive boulder will slide such that the big boulder will meet its demise as it slides 1.24 miles (2 km) to the crater floor.


[table="head;width=400"]
Click on image for details​


This image shows a vertical view of the Tycho central peak summit, highlighting the same 400-foot-wide boulder as in the above image.
(Credit: NASA Goddard/Arizona State University)​
[/table]​


{...}


Related Links:
 
Back
Top